Agent Observability with Cloud Trace
使用 Cloud Trace 进行智能体可观测性
With ADK, you've already capable of inspecting and observing your agent interaction locally utilizing the powerful web development UI discussed in here. However, if we aim for cloud deployment, we will need a centralized dashboard to observe real traffic.
使用 ADK,您已经能够在本地利用此处讨论的强大 Web 开发 UI 检查和观察智能体交互。但是,如果我们旨在进行云部署,我们需要一个集中式仪表板来观察实时流量。
Cloud Trace is a component of Google Cloud Observability. It is a powerful tool for monitoring, debugging, and improving the performance of your applications by focusing specifically on tracing capabilities. For Agent Development Kit (ADK) applications, Cloud Trace enables comprehensive tracing, helping you understand how requests flow through your agent's interactions and identify performance bottlenecks or errors within your AI agents.
Cloud Trace 是 Google Cloud Observability 的一个组件。它是一个强大的工具,专门用于通过跟踪能力监控、调试和改进应用程序性能。对于 Agent Development Kit (ADK) 应用程序,Cloud Trace 提供全面的跟踪功能,帮助您了解请求如何通过智能体交互流动,并识别 AI 智能体中的性能瓶颈或错误。
Overview
概述
Cloud Trace is built on OpenTelemetry, an open-source standard that supports many languages and ingestion methods for generating trace data. This aligns with observability practices for ADK applications, which also leverage OpenTelemetry-compatible instrumentation, allowing you to :
Cloud Trace 基于 OpenTelemetry 构建,这是一个开源标准,支持多种语言和摄取方法来生成跟踪数据。这与 ADK 应用程序的可观测性实践一致,后者也利用 OpenTelemetry 兼容的插桩,允许您:
- Trace agent interactions : Cloud Trace continuously gathers and analyzes trace data from your project, enabling you to rapidly diagnose latency issues and errors within your ADK applications. This automatic data collection simplifies the process of identifying problems in complex agent workflows.
- 跟踪智能体交互: Cloud Trace 持续收集和分析您项目中的跟踪数据,使您能够快速诊断 ADK 应用程序中的延迟问题和错误。这种自动数据收集简化了在复杂智能体工作流中识别问题的过程。
- Debug issues : Quickly diagnose latency issues and errors by analyzing detailed traces. Crucial for understanding issues that manifest as increased communication latency across different services or during specific agent actions like tool calls.
- 调试问题: 通过分析详细的跟踪,快速诊断延迟问题和错误。对于理解表现为跨不同服务的通信延迟增加或在特定智能体操作(如工具调用)期间出现的问题至关重要。
- In-depth Analysis and Visualization: Trace Explorer is the primary tool for analyzing traces, offering visual aids like heatmaps for span duration and line charts for request/error rates. It also provides a spans table, groupable by service and operation, which gives one-click access to representative traces and a waterfall view to easily identify bottlenecks and sources of errors within your agent's execution path
- 深入分析和可视化: Trace Explorer 是分析跟踪的主要工具,提供诸如 span 持续时间的热图和请求/错误率的折线图等视觉辅助。它还提供了一个 spans 表,可按服务和操作分组,可一键访问代表性跟踪和瀑布图,以便轻松识别智能体执行路径中的瓶颈和错误源
The following example will assume the following agent directory structure
以下示例将假设以下智能体目录结构
working_dir/
├── weather_agent/
│   ├── agent.py
│   └── __init__.py
└── deploy_agent_engine.py
└── deploy_fast_api_app.py
└── agent_runner.py
# weather_agent/agent.py

import os
from google.adk.agents import Agent

os.environ.setdefault("GOOGLE_CLOUD_PROJECT", "{your-project-id}")
os.environ.setdefault("GOOGLE_CLOUD_LOCATION", "global")
os.environ.setdefault("GOOGLE_GENAI_USE_VERTEXAI", "True")


# Define a tool function
# 定义工具函数
def get_weather(city: str) -> dict:
    """Retrieves the current weather report for a specified city.

    Args:
        city (str): The name of the city for which to retrieve the weather report.

    Returns:
        dict: status and result or error msg.
    """
    if city.lower() == "new york":
        return {
            "status": "success",
            "report": (
                "The weather in New York is sunny with a temperature of 25 degrees"
                " Celsius (77 degrees Fahrenheit)."
            ),
        }
    else:
        return {
            "status": "error",
            "error_message": f"Weather information for '{city}' is not available.",
        }


# Create an agent with tools
# 创建带有工具的智能体
root_agent = Agent(
    name="weather_agent",
    model="gemini-2.5-flash",
    description="Agent to answer questions using weather tools.",
    instruction="You must use the available tools to find an answer.",
    tools=[get_weather],
)
Cloud Trace Setup
Cloud Trace 设置
Setup for Agent Engine Deployment
Agent Engine 部署的设置
Agent Engine Deployment - from ADK CLI
从 ADK CLI 进行 Agent Engine 部署
You can enable cloud tracing by adding --trace_to_cloud flag when deploying your agent using adk deploy agent_engine command for agent engine deployment.
当使用 adk deploy agent_engine 命令进行智能体引擎部署时,您可以通过添加 --trace_to_cloud 标志来启用云跟踪。
adk deploy agent_engine \
    --project=$GOOGLE_CLOUD_PROJECT \
    --region=$GOOGLE_CLOUD_LOCATION \
    --staging_bucket=$STAGING_BUCKET \
    --trace_to_cloud \
    $AGENT_PATH
Agent Engine Deployment - from Python SDK
从 Python SDK 进行 Agent Engine 部署
If you prefer using Python SDK, you can enable cloud tracing by adding enable_tracing=True when initialize the AdkApp object
如果您更喜欢使用 Python SDK,可以在初始化 AdkApp 对象时通过添加 enable_tracing=True 来启用云跟踪
# deploy_agent_engine.py

from vertexai.preview import reasoning_engines
from vertexai import agent_engines
from weather_agent.agent import root_agent

import vertexai

PROJECT_ID = "{your-project-id}"
LOCATION = "{your-preferred-location}"
STAGING_BUCKET = "{your-staging-bucket}"

vertexai.init(
    project=PROJECT_ID,
    location=LOCATION,
    staging_bucket=STAGING_BUCKET,
)

adk_app = reasoning_engines.AdkApp(
    agent=root_agent,
    enable_tracing=True,
)


remote_app = agent_engines.create(
    agent_engine=adk_app,
    extra_packages=[
        "./weather_agent",
    ],
    requirements=[
        "google-cloud-aiplatform[adk,agent_engines]",
    ],
)
Setup for Cloud Run Deployment
Cloud Run 部署的设置
Cloud Run Deployment - from ADK CLI
从 ADK CLI 进行 Cloud Run 部署
You can enable cloud tracing by adding --trace_to_cloud flag when deploying your agent using adk deploy cloud_run command for cloud run deployment.
当使用 adk deploy cloud_run 命令进行 cloud run 部署时,您可以通过添加 --trace_to_cloud 标志来启用云跟踪。
adk deploy cloud_run \
    --project=$GOOGLE_CLOUD_PROJECT \
    --region=$GOOGLE_CLOUD_LOCATION \
    --trace_to_cloud \
    $AGENT_PATH
If you want to enable cloud tracing and using a customized agent service deployment on Cloud Run, you can refer to the Setup for Customized Deployment section below
如果您想启用云跟踪并在 Cloud Run 上使用自定义的智能体服务部署,可以参考下面的自定义部署设置部分
Setup for Customized Deployment
自定义部署的设置
From Built-in get_fast_api_app Module
从内置的 get_fast_api_app 模块
If you want to customize your own agent service, you can enable cloud tracing by initialize the FastAPI app using built-in get_fast_api_app module and set trace_to_cloud=True
如果您想自定义自己的智能体服务,可以通过使用内置的 get_fast_api_app 模块初始化 FastAPI 应用并设置 trace_to_cloud=True 来启用云跟踪
# deploy_fast_api_app.py

import os
from google.adk.cli.fast_api import get_fast_api_app
from fastapi import FastAPI

# Set GOOGLE_CLOUD_PROJECT environment variable for cloud tracing
# 设置 GOOGLE_CLOUD_PROJECT 环境变量以进行云跟踪
os.environ.setdefault("GOOGLE_CLOUD_PROJECT", "alvin-exploratory-2")

# Discover the `weather_agent` directory in current working dir
# 在当前工作目录中发现 `weather_agent` 目录
AGENT_DIR = os.path.dirname(os.path.abspath(__file__))

# Create FastAPI app with enabled cloud tracing
# 创建启用了云跟踪的 FastAPI 应用
app: FastAPI = get_fast_api_app(
    agents_dir=AGENT_DIR,
    web=True,
    trace_to_cloud=True,
)

app.title = "weather-agent"
app.description = "API for interacting with the Agent weather-agent"


# Main execution
# 主执行
if __name__ == "__main__":
    import uvicorn

    uvicorn.run(app, host="0.0.0.0", port=8080)
From Customized Agent Runner
从自定义智能体运行器
If you want to fully customize your ADK agent runtime, you can enable cloud tracing by using CloudTraceSpanExporter module from Opentelemetry.
如果您想完全自定义 ADK 智能体运行时,可以通过使用 Opentelemetry 的 CloudTraceSpanExporter 模块来启用云跟踪。
# agent_runner.py

from google.adk.runners import Runner
from google.adk.sessions import InMemorySessionService
from weather_agent.agent import root_agent as weather_agent
from google.genai.types import Content, Part
from opentelemetry import trace
from opentelemetry.exporter.cloud_trace import CloudTraceSpanExporter
from opentelemetry.sdk.trace import export
from opentelemetry.sdk.trace import TracerProvider

APP_NAME = "weather_agent"
USER_ID = "u_123"
SESSION_ID = "s_123"

provider = TracerProvider()
processor = export.BatchSpanProcessor(
    CloudTraceSpanExporter(project_id="{your-project-id}")
)
provider.add_span_processor(processor)
trace.set_tracer_provider(provider)

session_service = InMemorySessionService()
runner = Runner(agent=weather_agent, app_name=APP_NAME, session_service=session_service)


async def main():
    session = await session_service.get_session(
        app_name=APP_NAME, user_id=USER_ID, session_id=SESSION_ID
    )
    if session is None:
        session = await session_service.create_session(
            app_name=APP_NAME, user_id=USER_ID, session_id=SESSION_ID
        )

    user_content = Content(
        role="user", parts=[Part(text="what's weather in paris?")]
    )

    final_response_content = "No response"
    async for event in runner.run_async(
        user_id=USER_ID, session_id=SESSION_ID, new_message=user_content
    ):
        if event.is_final_response() and event.content and event.content.parts:
            final_response_content = event.content.parts[0].text

    print(final_response_content)


if __name__ == "__main__":
    import asyncio

    asyncio.run(main())
Inspect Cloud Traces
检查 Cloud 跟踪
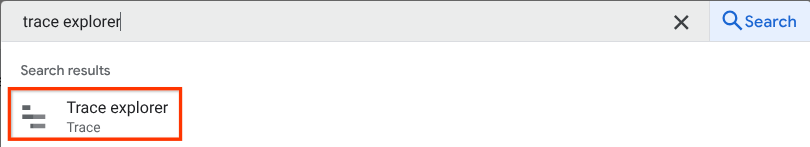
After the setup is complete, whenever you interact with the agent it will automatically send trace data to Cloud Trace. You can inspect the traces by going to console.cloud.google.com and visit the Trace Explorer on the configured Google Cloud Project
设置完成后,每当您与智能体交互时,它将自动向 Cloud Trace 发送跟踪数据。您可以通过前往 console.cloud.google.com 并访问配置的 Google Cloud Project 上的 Trace Explorer 来检查跟踪
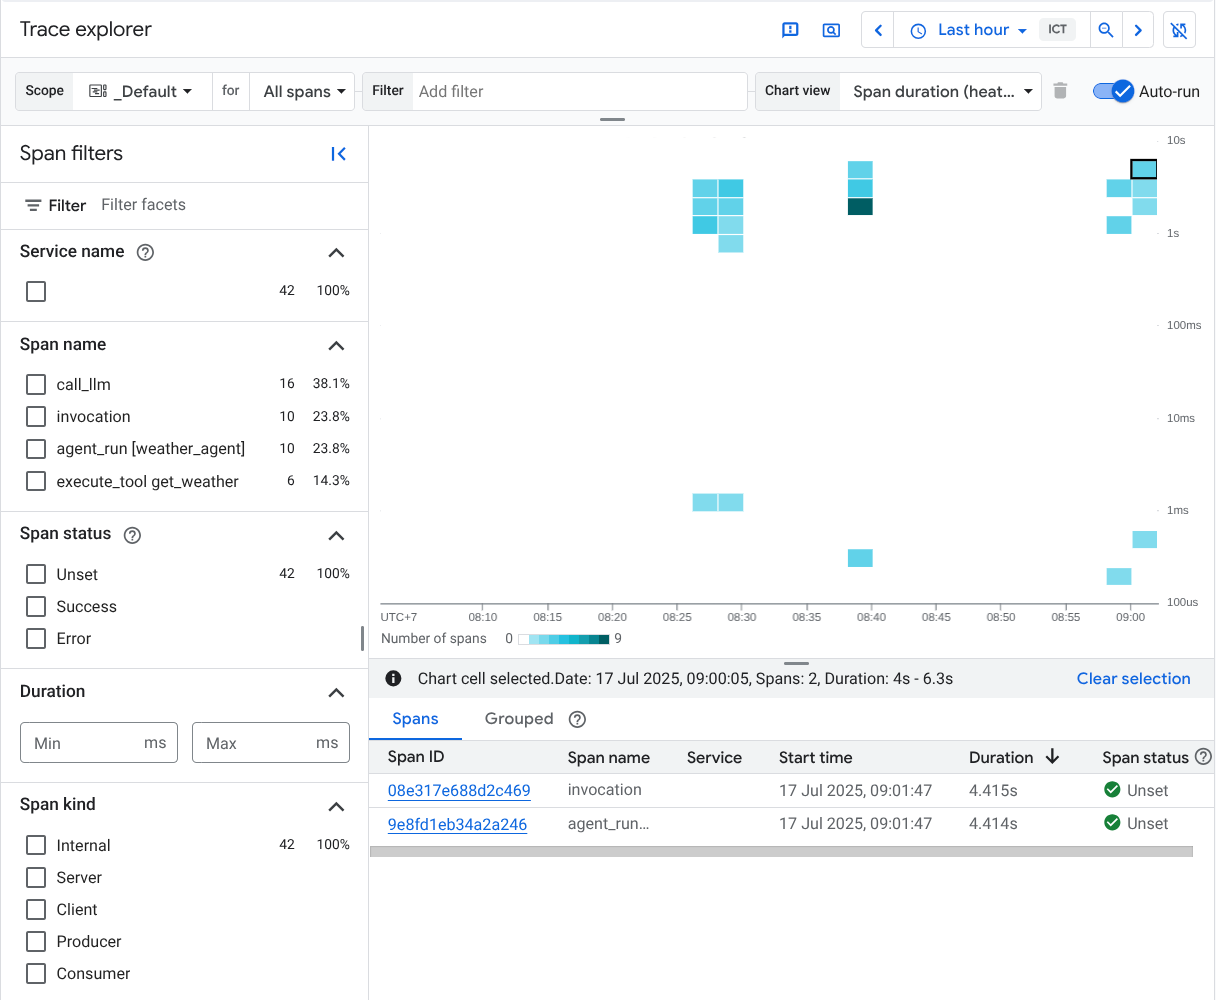
And then you will see all available traces produced by ADK agent which configured in several span names such as invocation , agent_run . call_llm and execute_tool
然后您将看到 ADK 智能体生成的所有可用跟踪,这些跟踪配置为多个 span 名称,如 invocation、agent_run、call_llm 和 execute_tool
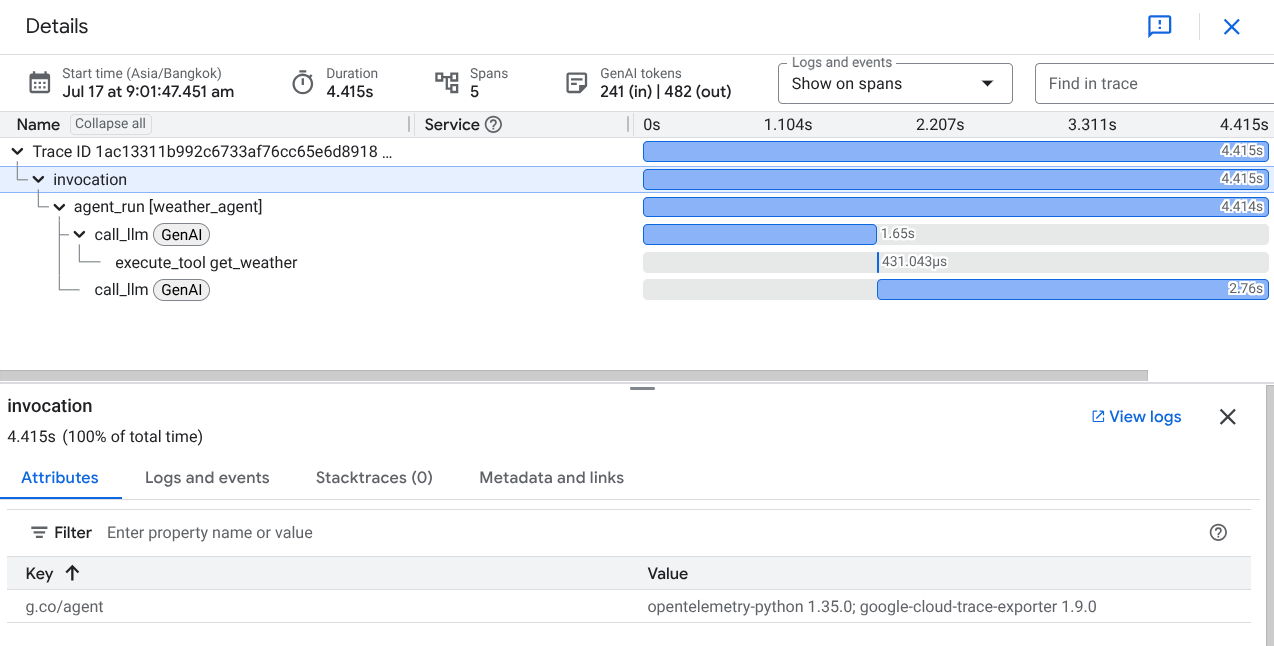
If you click on one of the traces, you will see the waterfall view of the detailed process, similar to what we see in the web development UI with adk web command.
如果您点击其中一个跟踪,您将看到详细过程的瀑布图,类似于我们使用 adk web 命令在 Web 开发 UI 中看到的内容。