Agent Observability with MLflow
使用 MLflow 进行智能体可观测性
MLflow Tracing provides first-class support for ingesting OpenTelemetry (OTel) traces. Google ADK emits OTel spans for agent runs, tool calls, and model requests, which you can send directly to an MLflow Tracking Server for analysis and debugging.
MLflow Tracing 提供了对摄取 OpenTelemetry (OTel) 跟踪的一流支持。Google ADK 为智能体运行、工具调用和模型请求发出 OTel spans,您可以直接将其发送到 MLflow Tracking Server 进行分析和调试。
Prerequisites
先决条件
- MLflow version 3.6.0 or newer. OpenTelemetry ingestion is only supported in MLflow 3.6.0+.
- MLflow 版本 3.6.0 或更新版本。OpenTelemetry 摄取仅在 MLflow 3.6.0+ 中受支持。
- A SQL-based backend store (e.g., SQLite, PostgreSQL, MySQL). File-based stores do not support OTLP ingestion.
- 基于 SQL 的后端存储(例如,SQLite、PostgreSQL、MySQL)。基于文件的存储不支持 OTLP 摄取。
- Google ADK installed in your environment.
- 在您的环境中安装了 Google ADK。
Install dependencies
安装依赖项
Start the MLflow Tracking Server
启动 MLflow Tracking Server
Start MLflow with a SQL backend and a port (5000 in this example):
使用 SQL 后端和端口(本示例中为 5000)启动 MLflow:
You can point --backend-store-uri to other SQL backends (PostgreSQL, MySQL,
MSSQL). OTLP ingestion is not supported with file-based backends.
您可以将 --backend-store-uri 指向其他 SQL 后端(PostgreSQL、MySQL、MSSQL)。基于文件的后端不支持 OTLP 摄取。
Configure OpenTelemetry (required)
配置 OpenTelemetry(必需)
You must configure an OTLP exporter and set a global tracer provider before using any ADK components so that spans are emitted to MLflow.
在使用任何 ADK 组件之前,您必须配置 OTLP 导出器并设置全局跟踪提供程序,以便将 spans 发送到 MLflow。
Initialize the OTLP exporter and global tracer provider in code before importing or constructing ADK agents/tools:
在导入或构造 ADK 智能体/工具之前,在代码中初始化 OTLP 导出器和全局跟踪提供程序:
# my_agent/agent.py
from opentelemetry import trace
from opentelemetry.exporter.otlp.proto.http.trace_exporter import OTLPSpanExporter
from opentelemetry.sdk.trace import TracerProvider
from opentelemetry.sdk.trace.export import SimpleSpanProcessor

exporter = OTLPSpanExporter(
    endpoint="http://localhost:5000/v1/traces",
    headers={"x-mlflow-experiment-id": "123"}  # replace with your experiment id
)

provider = TracerProvider()
provider.add_span_processor(SimpleSpanProcessor(exporter))
trace.set_tracer_provider(provider)  # set BEFORE importing/using ADK
This configures the OpenTelemetry pipeline and sends ADK spans to the MLflow server on each run.
这将配置 OpenTelemetry 管道,并在每次运行时将 ADK spans 发送到 MLflow 服务器。
Example: Trace an ADK agent
示例:跟踪 ADK 智能体
Now you can add the agent code for a simple math agent, after the code that sets up the OTLP exporter and tracer provider:
现在您可以添加简单数学智能体的智能体代码,放在设置 OTLP 导出器和跟踪提供程序的代码之后:
# my_agent/agent.py
from google.adk.agents import LlmAgent
from google.adk.tools import FunctionTool


def calculator(a: float, b: float) -> str:
    """Add two numbers and return the result."""
    return str(a + b)


calculator_tool = FunctionTool(func=calculator)

root_agent = LlmAgent(
    name="MathAgent",
    model="gemini-2.0-flash-exp",
    instruction=(
        "You are a helpful assistant that can do math. "
        "When asked a math problem, use the calculator tool to solve it."
    ),
    tools=[calculator_tool],
)
Run the agent with:
运行智能体:
And ask it a math problem:
并给它一个数学问题:
You should then see output similar to:
然后您应该看到类似于以下的输出:
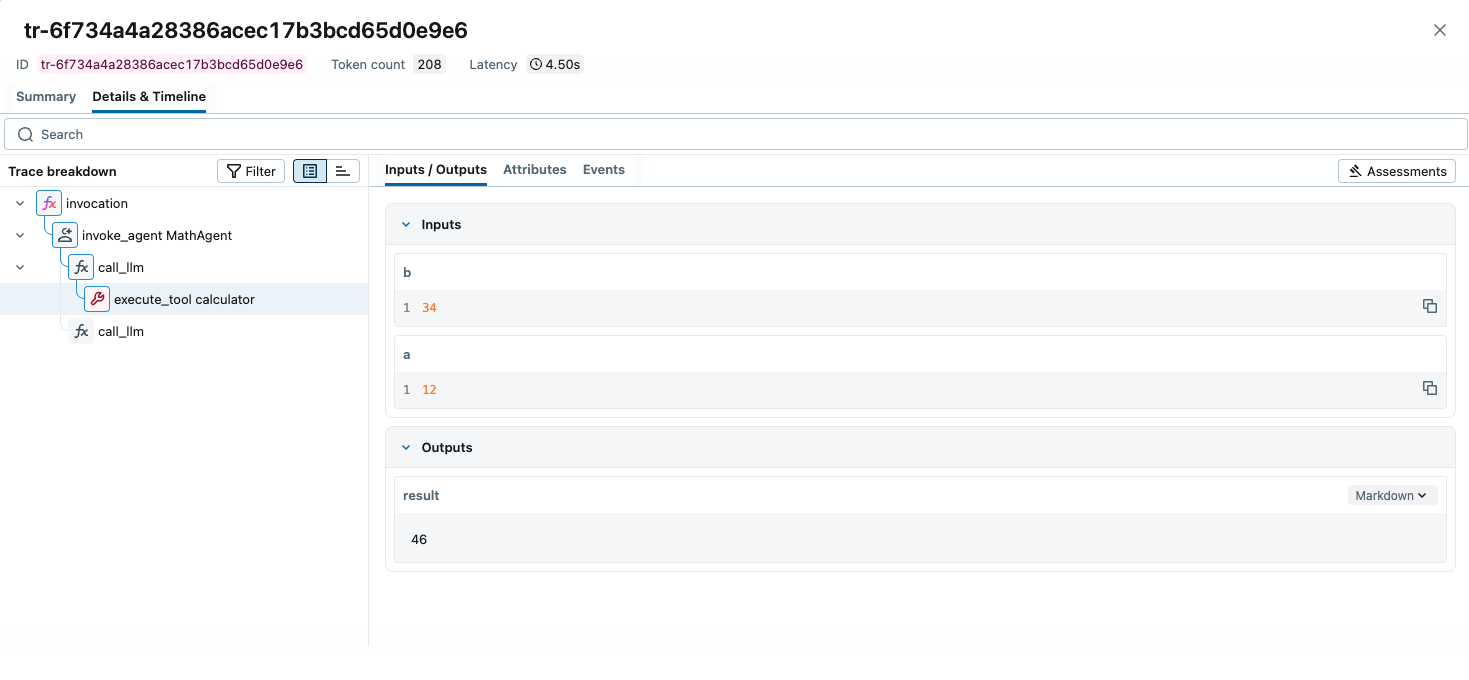
View traces in MLflow
在 MLflow 中查看跟踪
Open the MLflow UI at http://localhost:5000, select your experiment, and
inspect the trace tree and spans generated by your ADK agent.
在 http://localhost:5000 打开 MLflow UI,选择您的实验,并检查 ADK 智能体生成的跟踪树和 spans。
Tips
提示
- Set the tracer provider before importing or initializing ADK objects so all spans are captured.
- 在导入或初始化 ADK 对象之前设置跟踪提供程序,以便捕获所有 spans。
- Behind a proxy or on a remote host, replace
localhost:5000with your server address. - 如果在代理后面或远程主机上,将
localhost:5000替换为您的服务器地址。
Resources
资源
- MLflow Tracing Documentation: Official documentation for MLflow Tracing that covers other library integrations and downstream usage of traces, such as evaluation, monitoring, searching, and more.
- MLflow Tracing 文档:MLflow Tracing 的官方文档,涵盖其他库集成和跟踪的下游使用,如评估、监控、搜索等。
- OpenTelemetry in MLflow: Detailed guide on how to use OpenTelemetry with MLflow.
- MLflow 中的 OpenTelemetry:如何将 OpenTelemetry 与 MLflow 一起使用的详细指南。
- MLflow for Agents: Comprehensive guide on how to use MLflow for building production-ready agents.
- MLflow 智能体指南:如何使用 MLflow 构建生产就绪智能体的综合指南。