Agent Observability with Monocle
使用 Monocle 进行智能体可观测性
Monocle is an open-source observability platform for monitoring, debugging, and improving LLM applications and AI Agents. It provides comprehensive tracing capabilities for your Google ADK applications through automatic instrumentation. Monocle generates OpenTelemetry-compatible traces that can be exported to various destinations including local files or console output.
Monocle 是一个开源的可观测性平台,用于监控、调试和改进 LLM 应用程序和 AI 智能体。它通过自动插桩为您的 Google ADK 应用程序提供全面的跟踪功能。Monocle 生成与 OpenTelemetry 兼容的跟踪,可以导出到各种目标,包括本地文件或控制台输出。
Overview
概述
Monocle automatically instruments Google ADK applications, allowing you to:
Monocle 自动为 Google ADK 应用程序插桩,允许您:
- Trace agent interactions - Automatically capture every agent run, tool call, and model request with full context and metadata
- 跟踪智能体交互 - 自动捕获每个智能体运行、工具调用和模型请求,包括完整的上下文和元数据
- Monitor execution flow - Track agent state, delegation events, and execution flow through detailed traces
- 监控执行流程 - 通过详细的跟踪跟踪智能体状态、委派事件和执行流程
- Debug issues - Analyze detailed traces to quickly identify bottlenecks, failed tool calls, and unexpected agent behavior
- 调试问题 - 分析详细的跟踪以快速识别瓶颈、失败的工具调用和意外的智能体行为
- Flexible export options - Export traces to local files or console for analysis
- 灵活的导出选项 - 将跟踪导出到本地文件或控制台进行分析
- OpenTelemetry compatible - Generate standard OpenTelemetry traces that work with any OTLP-compatible backend
- OpenTelemetry 兼容 - 生成标准的 OpenTelemetry 跟踪,可与任何 OTLP 兼容的后端一起使用
Monocle automatically instruments the following Google ADK components:
Monocle 自动为以下 Google ADK 组件插桩:
BaseAgent.run_async- Captures agent execution, agent state, and delegation eventsBaseAgent.run_async- 捕获智能体执行、智能体状态和委派事件FunctionTool.run_async- Captures tool execution, including tool name, parameters, and resultsFunctionTool.run_async- 捕获工具执行,包括工具名称、参数和结果Runner.run_async- Captures runner execution, including request context and execution flowRunner.run_async- 捕获运行器执行,包括请求上下文和执行流程
Installation
安装
1. Install Required Packages
1. 安装必需的包
Setup
设置
1. Configure Monocle Telemetry
1. 配置 Monocle 遥测
Monocle automatically instruments Google ADK when you initialize telemetry. Simply call setup_monocle_telemetry() at the start of your application:
当您初始化遥测时,Monocle 会自动为 Google ADK 插桩。只需在应用程序开始时调用 setup_monocle_telemetry():
from monocle_apptrace import setup_monocle_telemetry

# Initialize Monocle telemetry - automatically instruments Google ADK
# 初始化 Monocle 遥测 - 自动为 Google ADK 插桩
setup_monocle_telemetry(workflow_name="my-adk-app")
That's it! Monocle will automatically detect and instrument your Google ADK agents, tools, and runners.
就是这样!Monocle 将自动检测并为您插桩 Google ADK 智能体、工具和运行器。
2. Configure Exporters (Optional)
2. 配置导出器(可选)
By default, Monocle exports traces to local JSON files. You can configure different exporters using environment variables.
默认情况下,Monocle 将跟踪导出到本地 JSON 文件。您可以使用环境变量配置不同的导出器。
Export to Console (for debugging)
导出到控制台(用于调试)
Set the environment variable:
设置环境变量:
Export to Local Files (default)
导出到本地文件(默认)
Or simply omit the MONOCLE_EXPORTER variable - it defaults to file.
或者简单地省略 MONOCLE_EXPORTER 变量 - 它默认为 file。
Observe
观察
Now that you have tracing setup, all Google ADK SDK requests will be automatically traced by Monocle.
现在您已经设置了跟踪,所有 Google ADK SDK 请求都将由 Monocle 自动跟踪。
from monocle_apptrace import setup_monocle_telemetry
from google.adk.agents import Agent
from google.adk.runners import InMemoryRunner
from google.genai import types

# Initialize Monocle telemetry - must be called before using ADK
# 初始化 Monocle 遥测 - 必须在使用 ADK 之前调用
setup_monocle_telemetry(workflow_name="weather_app")

# Define a tool function
# 定义工具函数
def get_weather(city: str) -> dict:
    """Retrieves the current weather report for a specified city.

    Args:
        city (str): The name of the city for which to retrieve the weather report.

    Returns:
        dict: status and result or error msg.
    """
    if city.lower() == "new york":
        return {
            "status": "success",
            "report": (
                "The weather in New York is sunny with a temperature of 25 degrees"
                " Celsius (77 degrees Fahrenheit)."
            ),
        }
    else:
        return {
            "status": "error",
            "error_message": f"Weather information for '{city}' is not available.",
        }

# Create an agent with tools
# 创建带有工具的智能体
agent = Agent(
    name="weather_agent",
    model="gemini-2.0-flash-exp",
    description="Agent to answer questions using weather tools.",
    instruction="You must use the available tools to find an answer.",
    tools=[get_weather]
)

app_name = "weather_app"
user_id = "test_user"
session_id = "test_session"
runner = InMemoryRunner(agent=agent, app_name=app_name)
session_service = runner.session_service

await session_service.create_session(
    app_name=app_name,
    user_id=user_id,
    session_id=session_id
)

# Run the agent (all interactions will be automatically traced)
# 运行智能体(所有交互都将自动跟踪)
async for event in runner.run_async(
    user_id=user_id,
    session_id=session_id,
    new_message=types.Content(role="user", parts=[
        types.Part(text="What is the weather in New York?")]
    )
):
    if event.is_final_response():
        print(event.content.parts[0].text.strip())
Accessing Traces
访问跟踪
By default, Monocle generates traces in JSON files in the local directory ./monocle. The file name format is:
默认情况下,Monocle 在本地目录 ./monocle 中以 JSON 文件格式生成跟踪。文件名格式为:
Each trace file contains an array of OpenTelemetry-compatible spans that capture:
每个跟踪文件包含一组 OpenTelemetry 兼容的 spans,捕获:
- Agent execution spans - Agent state, delegation events, and execution flow
- 智能体执行 spans - 智能体状态、委派事件和执行流程
- Tool execution spans - Tool name, input parameters, and output results
- 工具执行 spans - 工具名称、输入参数和输出结果
- LLM interaction spans - Model calls, prompts, responses, and token usage (if using Gemini or other LLMs)
- LLM 交互 spans - 模型调用、提示词、响应和令牌使用(如果使用 Gemini 或其他 LLM)
You can analyze these trace files using any OpenTelemetry-compatible tool or write custom analysis scripts.
您可以使用任何 OpenTelemetry 兼容的工具分析这些跟踪文件,或编写自定义分析脚本。
Visualizing Traces with VS Code Extension
使用 VS Code 扩展可视化跟踪
The Okahu Trace Visualizer VS Code extension provides an interactive way to visualize and analyze Monocle-generated traces directly in Visual Studio Code.
Okahu Trace Visualizer VS Code 扩展提供了一种在 Visual Studio Code 中直接可视化和分析 Monocle 生成的跟踪的交互式方法。
Installation
安装
- Open VS Code
- 打开 VS Code
- Press
Ctrl+P(orCmd+Pon Mac) to open Quick Open - 按
Ctrl+P(Mac 上为Cmd+P)打开快速打开 - Paste the following command and press Enter:
- 粘贴以下命令并按 Enter:
Alternatively, you can install it from the VS Code Marketplace.
或者,您可以从 VS Code Marketplace 安装它。
Features
功能
The extension provides:
该扩展提供:
- Custom Activity Bar Panel - Dedicated sidebar for trace file management
- 自定义活动栏面板 - 专门用于跟踪文件管理的侧边栏
- Interactive File Tree - Browse and select trace files with custom React UI
- 交互式文件树 - 使用自定义 React UI 浏览和选择跟踪文件
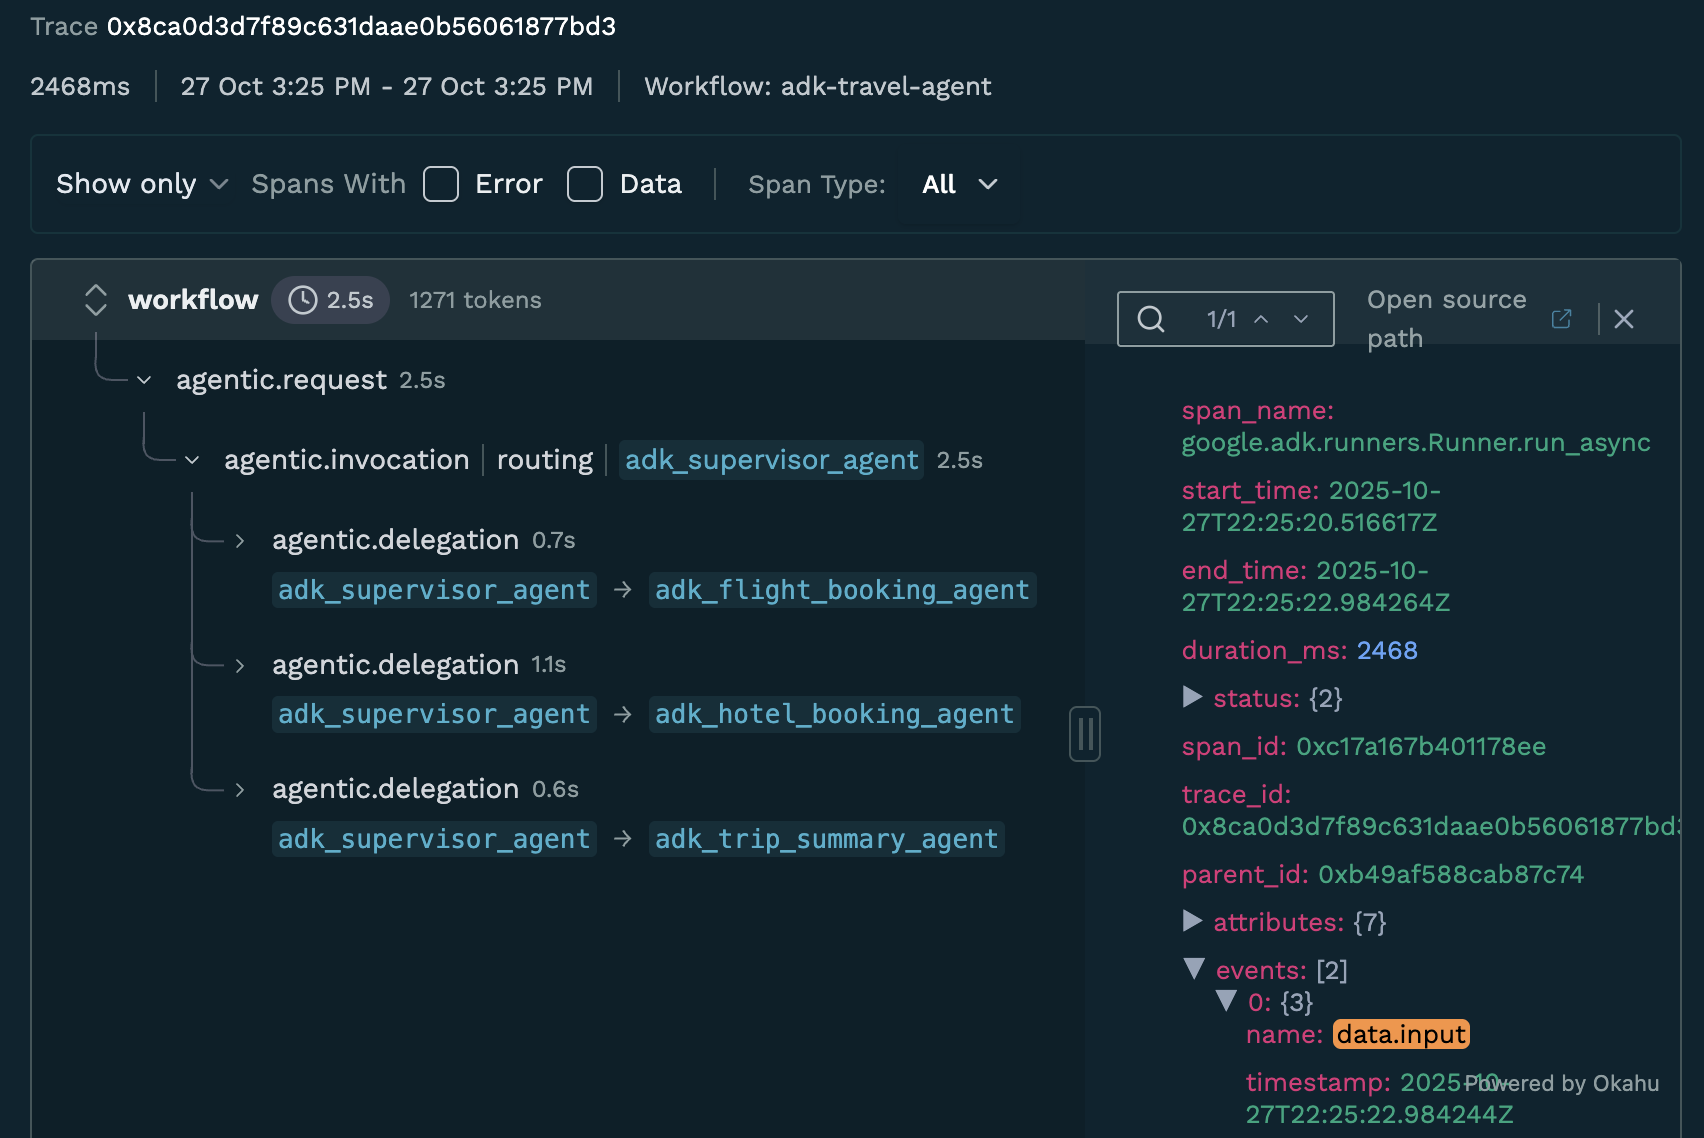
- Split View Analysis - Gantt chart visualization alongside JSON data viewer
- 分割视图分析 - 甘特图可视化与 JSON 数据查看器并列
- Real-time Communication - Seamless data flow between VS Code and React components
- 实时通信 - VS Code 和 React 组件之间的无缝数据流
- VS Code Theming - Fully integrated with VS Code's light/dark themes
- VS Code 主题 - 完全集成 VS Code 的浅色/深色主题
Usage
使用
- After running your ADK application with Monocle tracing enabled, trace files will be generated in the
./monocledirectory - 在启用 Monocle 跟踪的情况下运行 ADK 应用程序后,跟踪文件将在
./monocle目录中生成 - Open the Okahu Trace Visualizer panel from the VS Code Activity Bar
- 从 VS Code 活动栏打开 Okahu Trace Visualizer 面板
- Browse and select trace files from the interactive file tree
- 从交互式文件树中浏览和选择跟踪文件
- View your traces with:
- 使用以下方式查看跟踪:
- Gantt chart visualization - See the timeline and hierarchy of spans
- 甘特图可视化 - 查看 spans 的时间线和层次结构
- JSON data viewer - Inspect detailed span attributes and events
- JSON 数据查看器 - 检查详细的 span 属性和事件
- Token counts - View token usage for LLM calls
- 令牌计数 - 查看 LLM 调用的令牌使用
- Error badges - Quickly identify failed operations
- 错误徽章 - 快速识别失败的操作
What Gets Traced
跟踪什么
Monocle automatically captures the following information from Google ADK:
Monocle 自动从 Google ADK 捕获以下信息:
- Agent Execution: Agent state, delegation events, and execution flow
- 智能体执行: 智能体状态、委派事件和执行流程
- Tool Calls: Tool name, input parameters, and output results
- 工具调用: 工具名称、输入参数和输出结果
- Runner Execution: Request context and overall execution flow
- 运行器执行: 请求上下文和总体执行流程
- Timing Information: Start time, end time, and duration for each operation
- 时间信息: 每个操作的开始时间、结束时间和持续时间
- Error Information: Exceptions and error states
- 错误信息: 异常和错误状态
All traces are generated in OpenTelemetry format, making them compatible with any OTLP-compatible observability backend.
所有跟踪都以 OpenTelemetry 格式生成,使其与任何 OTLP 兼容的可观测性后端兼容。